South African and Brazilian P.1 Variants Detected in L.A. County; Metrics Indicate Less Community Transmission as Vaccinations Expand
53 New Deaths and 479 New Confirmed Cases of COVID-19 in Los Angeles County
The Los Angeles County Department of Public Health (Public Health) has confirmed 53 new deaths and 479 new cases of COVID-19. To date, Public Health identified 1,223,174 positive cases of COVID-19 across all areas of L.A. County and a total of 23,340 deaths.
Public Health has identified one case of the South African variant, B.1.351, and three cases of the Brazilian P.1 variant, both variants of concern. The Centers for Disease Control and Prevention (CDC) classified the South African and Brazilian variants as variants of concern because they are potentially associated with increased transmissibility and reduced susceptibility to certain therapeutics. Although these are the first reported cases of the South African and Brazilian variant in L.A. County, it is likely there are additional undetected/undiagnosed cases. To date, 33 cases of the Brazilian variant and 10 cases of the South African variant have been reported in California.
Among 70 specimens analyzed at the Public Health Laboratory this past week, 64% of the specimens analyzed were the UK variant of concern, B.1.1.7 and 20% were the California variant of concern identified as B.1.427 or 429. This means 84% of the variants identified this past week are variants of concern with the probability of increased transmissibility and more severe disease. Three cases of the New York variant were also detected this week, which is a variant of interest. There were no cases of the Brazilian P.2 variant identified this week.
All key metrics indicate less community transmission; the rate of decrease is slowing for hospitalizations and cases.
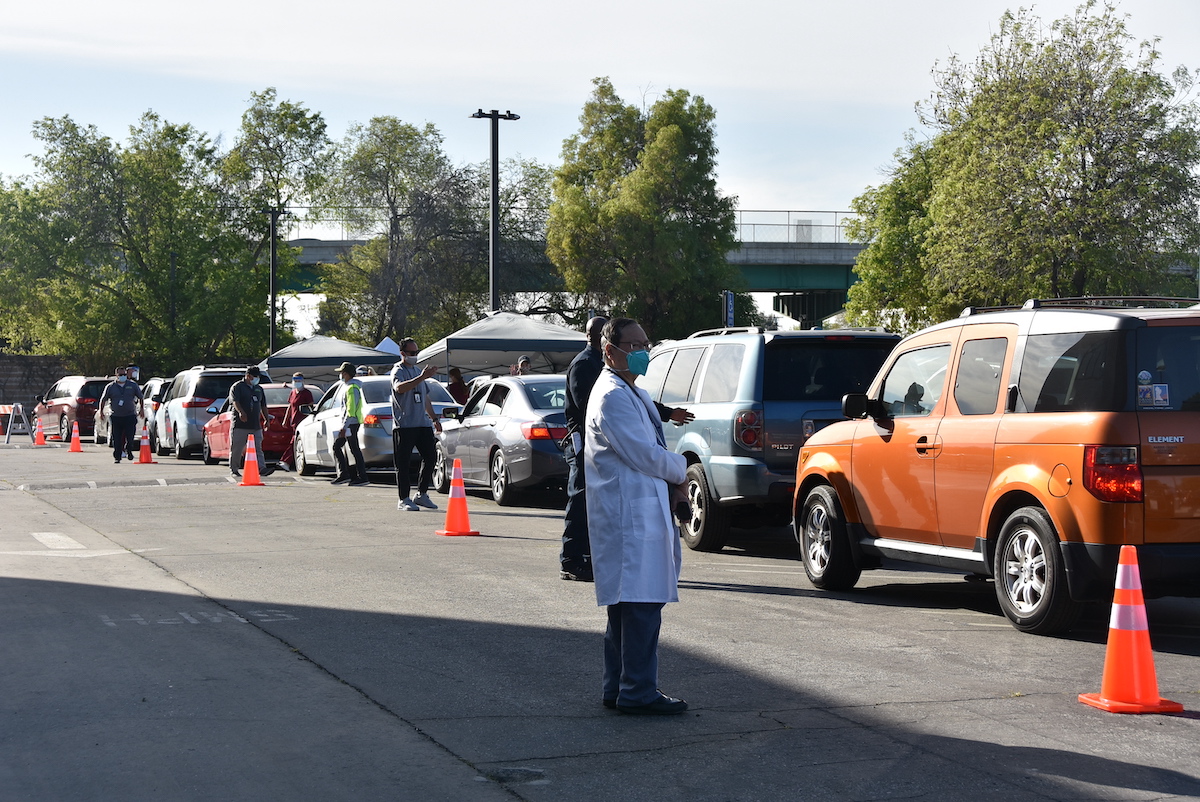
馬凱博高中外面排著長長的車龍。(主辦單位提供)
During the month of February, the daily number of cases dropped 82% from February 1 to February 28. During the month of March, the daily number of cases continued to decrease, but dropped only 42% from March 1 to March 30. There is a similar slowing for hospitalizations, as well. During the month of February, the number of daily hospitalizations dropped 70% from February 1 to February 28 with only a 57% drop from March 1 to March 30.
Thankfully, the average number of daily deaths continued to decrease in March compared with February. The daily number of deaths dropped 63% from February 1 to February 28. In March, average daily deaths decreased by 86% from March 1 to March 30. This is welcomed news as it indicates we are still seeing declines in the very high number of deaths L.A. County experienced through January and February.
Of the 53 new deaths reported today, 21 people that passed away were over the age of 80, 14 people who died were between the ages of 65 and 79, 12 people who died were between the ages of 50 and 64, and two people who died were between the ages of 30 and 49. Three deaths were reported by the City of Long Beach and one death was reported by the City of Pasadena.
There are 552 people with COVID-19 currently hospitalized and 25% of these people are in the ICU. Testing results are available for nearly 6,150,000 individuals with 18% of people testing positive.
“To the friends and families mourning a loved one who passed away from COVID-19, we are sending our love and prayers during your time of grief,” said Barbara Ferrer, PhD, MPH, MEd, Director of Public Health. “I want to express how grateful I am to our residents and businesses for following the safety measures. We are now more than three weeks out from when we moved to the red tier, and we have not yet seen any increases in our case rates, test positivity rate, or hospitalizations. This is only possible because of our collective commitment to each other. Please continue keeping yourself, your friends, and your families safe. With the majority of variants identified in Los Angeles County being variants of concern, it is even more important that we take all precautions during our re-openings to limit increases in community transmission. Wear a mask, distance when around other in public, wash your hands, and make an appointment to get vaccinated when you are eligible.”
Public Health continues to track data that shows how different races and ethnicities and those living in lower resourced areas are experiencing COVID-19. Thankfully, gaps are closing. The daily case rate for White residents is 50 cases a day per 100,000 people. For Black/African American residents, the rate is 52 cases per 100,000 people. And for Latino/Latinx residents, the rate is 56 cases per 100,000 people. Asian residents have the lowest case rate at 24 cases per 100,000 people.
The disproportionality across groups played out in devastating ways when we look at rates of death by race and ethnicity, and while there are declines for all groups, the Latinx community continues to see the most tragedy and loss. When the surge began in early November, the average number of Latinx residents who passed away each day was 3.4 deaths per 100,000 people and then sharply increased to 59 deaths per 100,000 people in mid-January. As of March 26, the mortality rate among Latinx residents declined to 4 deaths per 100,000 people, yet still remains two and half times more than the mortality rate for White residents and higher than the mortality rate for all other groups. Since mid-January, the mortality rate among Black residents decreased from nearly 29 deaths per 100,000 Black residents to less than 2 deaths per 100,000 Black residents. Deaths among Asian residents have declined since the peak from 26 deaths per 100,000 Asian residents to 1.5 deaths per 100,000 Asian residents in late March.
As of March 26, the mortality rate among residents in the lowest resourced areas is down significantly to just 4.5 daily deaths per 100,000 people, but is still three times higher than the mortality rate for people living the highest resourced areas, which has dropped to 1.5 daily deaths per 100,000 people.
From January 2020 to date, 7,011 people experiencing homelessness in Los Angeles County tested positive for COVID-19 and 202 people who were experiencing homelessness passed away from COVID-19. Similar to the overall trend in L.A. County, COVID-19 cases among people experiencing homelessness have declined significantly from the peak of 652 weekly cases during late-December, to fewer than six new cases reported last week. The number of deaths per week from COVID-19 among people experiencing homelessness peaked at 19 deaths in late December and have declined significantly to 1 death last week.
Vaccinations for people experiencing homelessness began in February 2021. Since then, dozens of providers across the county have administered 11,483 COVID-19 vaccine doses to people experiencing homelessness. To lower barriers to vaccination, the County is employing both traditional clinic-based vaccination models and heavily relying on mobile teams to bring vaccine to people experiencing homelessness where they are, including shelters, encampments, churches and access centers. People experiencing homelessness are particularly vulnerable and we are thankful to the many partners committed to continuing and expanding these efforts.
Public Health remains committed to increasing the number of vaccination sites in the hardest hit communities in L.A. County. Similar to efforts for vaccinating people in hard hit communities, the county deploys mobile vaccination teams to congregate senior housing facilities where many homebound individuals live. The County is partnering with programs such as Meals on Wheels and other home delivered meal programs, community-based organizations, hospice agencies, the Los Angeles County Department Of Workforce Development, Aging and Community Services, and the City of LA Department of Aging to identify homebound individuals in need of vaccination. Local fire departments and the County’s Sherriff Department are critical partners in this effort. To date, 15 local fire departments have partnered with us to vaccinate homebound residents, and we expect more in the coming weeks.
While gaps in vaccination rates persist by race and ethnicity for residents 65 and older, since February, Black residents 65 and older have seen the largest increase in vaccination rates at 145%. The County is also seeing large increases in the vaccination rate for Latinx residents, which increased by 114% from February 9 to April 2. Over this time period, the rate for American Indian/Alaska Native increased by nearly 110%. These increases translate into more protection for all with just about 50% or more of people 65 and older vaccinated across each race/ethnic group.
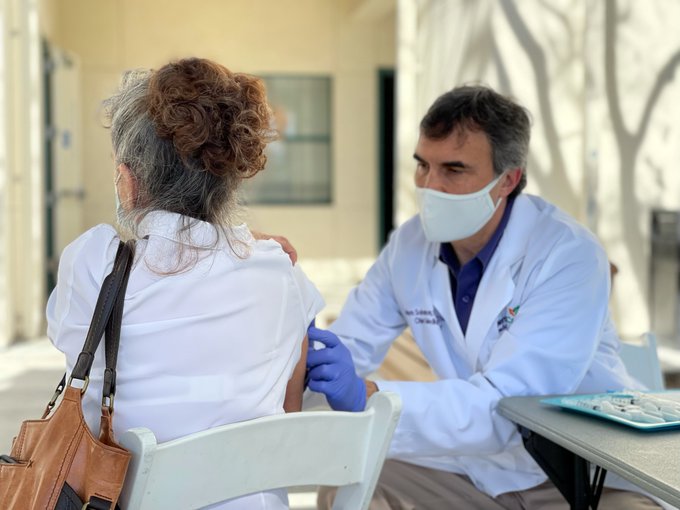
COVID-19 vaccine eligibility expanded to all residents 50 through 64 years old in addition to all other eligible groups. On April 15, vaccines become available to any resident in Los Angeles County who is 16 and older.
For information about who is eligible for COVID-19 vaccine in L.A. County, how to make an appointment if it is your turn, what verifications you will need to show at your vaccination appointment, and much more, visit: www.VaccinateLACounty.com (English) and www.VacunateLosAngeles.com (Spanish). Vaccinations are always free and open to eligible residents and workers regardless of immigration status.
County Reopening Protocols, COVID-19 Surveillance Interactive Dashboard, Roadmap to Recovery, Recovery Dashboard, and additional actions you can take to protect yourself, your family and your community are on the Public Health website, www.publichealth.
Please see additional information below:
|
|
Total Cases |
|
|
Laboratory Confirmed Cases |
1223174 |
|
|
— Los Angeles County (excl. LB and Pas)* |
1159674 |
|
|
— Long Beach |
52343 |
|
|
— Pasadena |
11157 |
|
|
Deaths |
23340 |
|
|
— Los Angeles County (excl. LB and Pas) |
22087 |
|
|
— Long Beach |
917 |
|
|
— Pasadena |
336 |
|
|
Age Group (Los Angeles County Cases Only-excl LB and Pas) |
|
|
|
– 0 to 4 |
28899 |
|
|
– 5 to 11 |
55146 |
|
|
– 12 to 17 |
69159 |
|
|
– 18 to 29 |
274257 |
|
|
– 30 to 49 |
385621 |
|
|
– 50 to 64 |
224091 |
|
|
– 65 to 79 |
89293 |
|
|
– over 80 |
32516 |
|
|
– Under Investigation |
692 |
|
|
Gender (Los Angeles County Cases Only-excl LB and Pas) |
|
|
|
– Female |
587920 |
|
|
– Male |
549681 |
|
|
– Other |
623 |
|
|
– Under Investigation |
21450 |
|
|
Race/Ethnicity (Los Angeles County Cases Only-excl LB and Pas) |
|
|
|
– American Indian/Alaska Native |
1964 |
|
|
– Asian |
54023 |
|
|
– Black |
43490 |
|
|
– Hispanic/Latino |
592779 |
|
|
– Native Hawaiian/Pacific Islander |
4185 |
|
|
– White |
123461 |
|
|
– Other |
103482 |
|
|
– Under Investigation |
236290 |
|
|
Hospitalization (Los Angeles County Cases Only-excl LB and Pas) |
|
|
|
– Hospitalized (Ever) |
85371 |
|
|
Deaths Race/Ethnicity (Los Angeles County Cases Only-excl LB and Pas) |
|
|
|
– American Indian/Alaska Native |
41 |
|
|
– Asian |
2902 |
|
|
– Black |
1750 |
|
|
– Hispanic/Latino |
11782 |
|
|
– Native Hawaiian/Pacific Islander |
91 |
|
|
– White |
5126 |
|
|
– Other |
344 |
|
|
– Under Investigation |
51 |
|
|
CITY / COMMUNITY** |
Cases |
Case Rate |
|
City of Agoura Hills |
1015 |
4860 |
|
City of Alhambra |
6773 |
7810 |
|
City of Arcadia |
2672 |
4627 |
|
City of Artesia |
2045 |
12176 |
|
City of Avalon |
16 |
414 |
|
City of Azusa |
6239 |
12468 |
|
City of Baldwin Park |
13014 |
16952 |
|
City of Bell |
6727 |
18515 |
|
City of Bell Gardens |
8286 |
19238 |
|
City of Bellflower |
10590 |
13623 |
|
City of Beverly Hills |
2628 |
7613 |
|
City of Bradbury |
35 |
3274 |
|
City of Burbank |
8687 |
8105 |
|
City of Calabasas |
1223 |
5028 |
|
City of Carson |
9480 |
10102 |
|
City of Cerritos |
3001 |
5994 |
|
City of Claremont |
2238 |
6134 |
|
City of Commerce* |
2385 |
18249 |
|
City of Compton |
16754 |
16770 |
|
City of Covina |
6339 |
12928 |
|
City of Cudahy |
4755 |
19530 |
|
City of Culver City |
2169 |
5441 |
|
City of Diamond Bar |
3192 |
5550 |
|
City of Downey |
17305 |
15145 |
|
City of Duarte |
2290 |
10402 |
|
City of El Monte |
17045 |
14535 |
|
City of El Segundo |
700 |
4170 |
|
City of Gardena |
6218 |
10142 |
|
City of Glendale |
19570 |
9477 |
|
City of Glendora |
4733 |
8970 |
|
City of Hawaiian Gardens |
2208 |
15045 |
|
City of Hawthorne |
10290 |
11590 |
|
City of Hermosa Beach |
966 |
4911 |
|
City of Hidden Hills |
87 |
4603 |
|
City of Huntington Park |
11147 |
18739 |
|
City of Industry |
168 |
38444 |
|
City of Inglewood |
13359 |
11762 |
|
City of Irwindale |
249 |
17066 |
|
City of La Canada Flintridge |
746 |
3605 |
|
City of La Habra Heights |
110 |
2016 |
|
City of La Mirada |
4216 |
8500 |
|
City of La Puente |
6643 |
16323 |
|
City of La Verne |
2839 |
8530 |
|
City of Lakewood |
7162 |
8912 |
|
City of Lancaster* |
21647 |
13398 |
|
City of Lawndale |
3535 |
10516 |
|
City of Lomita |
1435 |
6923 |
|
City of Lynwood* |
13240 |
18377 |
|
City of Malibu |
400 |
3086 |
|
City of Manhattan Beach |
1304 |
3622 |
|
City of Maywood |
5176 |
18453 |
|
City of Monrovia |
3138 |
8088 |
|
City of Montebello |
10089 |
15672 |
|
City of Monterey Park |
4766 |
7655 |
|
City of Norwalk |
15923 |
14795 |
|
City of Palmdale |
24175 |
15207 |
|
City of Palos Verdes Estates |
443 |
3276 |
|
City of Paramount |
9845 |
17573 |
|
City of Pico Rivera |
11037 |
17169 |
|
City of Pomona |
24108 |
15461 |
|
City of Rancho Palos Verdes |
1462 |
3420 |
|
City of Redondo Beach |
2708 |
3942 |
|
City of Rolling Hills |
54 |
2784 |
|
City of Rolling Hills Estates |
274 |
3377 |
|
City of Rosemead |
4889 |
8833 |
|
City of San Dimas* |
3186 |
9231 |
|
City of San Fernando |


